An interesting high fiber experiment
What happens to the gut microbiome after shifting to a diet of higher vegetables?
If you rely simply on what you read, then we know what should happen: more vegetables are good for you, and your overall microbiome should benefit as a result. Does that really happen?
That’s exactly what Prashanth Rao tried, in a wonderful experiment “The effect of a high-fiber diet on my microbiome”:
- In January, I ate a diet containing larger amounts of whole grains and lentils, with some vegetables (around 5–8 kinds) the few days before taking my sample.
- In March, I ate much larger amounts of vegetables, including tubers, cruciferous and green vegetables, and a much larger variety of vegetables (more than 15 kinds) in the few days before taking my sample.
Before you read my comments, please first read (and then clap for!) his original post. It’s a well-written example of personal science at its best, and of course he also published his raw data and calculations which I downloaded to see what else we can learn.
First I looked at the overall picture at the broadest “Phylum” level:
| Before | After | |
|---|---|---|
| Firmicutes | 78.27 | 48.26 |
| Bacteroidetes | 18.30 | 46.13 |
| Actinobacteria | 2.48 | 4.71 |
| Proteobacteria | 0.95 | 0.90 |
As he discovered in his own analysis, he has only 4 non-zero taxa. As I’ll explain below, this isn’t uncommon in a sample with relatively low read counts, but we’ll have to keep in mind that his overall diversity numbers will appear lower than they (probably) are. By comparison, my most recent sample had about 10 non-zero phyla.
Similarly, he had 59 unique taxa at the genus level, about half what I see in higher-read samples. These numbers on their own are (almost) meaningless, since the 16S test itself misses many perfectly good taxa at that level. He could well have a zillion unique genus-level microbes, of which most just happen to be invisible to the 16S test. Still, since he and I are both comparing ourselves in the same lab, let’s for now agree that given these valid limitations his overall diversity is lower in the second sample than in the first.
That seems a bit odd intuitively – you’d think high fiber would increase diversity, by feeding a wider variety of microbes. He speculates on possible reasons – his job, the season of the year, etc. – though personally I suspect the lower read count and other limitations of the 16S sampling is a more likely explanation. It’ll be the subject of a future post to explain why I’m not sure diversity is necessarily desirable anyway – you could increase your diversity by adding a bunch of nasty pathogens, for example – but for now let’s just note that we see less in the sample taken after his higher-fiber experiment.
Watch the read counts
Gene sequencing is ultimately about reading individual base pairs of DNA, invisible molecules that are so tiny it’s a miracle we can understand them at all, much less get enough of them right that we can construct an idea of the species of which they are a part. Inevitably in such high precision work, there will be errors, the finding and correcting of which is an important step in the process. Generally, the solution is redundancy – read the same thing over and over and keep the results that agree between runs. Successfully deciphered DNA letters are called “reads”, and the more the better. Samples that leave the sequencing machine with too few total reads are thrown out. The bare minimum threshold at uBiome is 3000 reads for consumer products and 10,000 for the clinical products, but in my experience even those levels are pretty low. My samples typically weigh in close to 100,000 reads.
The total read count matters most when comparing two samples. Reads are a little like pixel counts on a TV screen. If you were looking at a zoo on a high resolution, full size monitor, you’ll see more animals than if you try to view the same scene on a low-resolution black and white watch-sized display. You can’t compare diversity between displays of different resolution.
In Prashanth’s case, both of his samples have relatively low read counts (2.0095^{4}, 3.4589^{4}). Despite that, and fortunately, both samples have roughly the same number of reads, so for one-on-one comparison it may not be that big of a deal, but it means he’ll have generally lower diversity altogether. It would be hard to compare his samples with some of my higher-read counts, for example.
Incidentally, that makes it tricky to rely on academic studies to guide you when looking for “interesting” results in your 16S sample. Older academic studies – say, before 2010 – were happy to get 1000 reads. But a sample with ten times that number of reads will appear to be higher on diversity and much more.
For fun, I reran his analysis using my R Phyloseq-based package on his data, using different software but coming to the same results, though his insights about specific microbes are much better than mine.
Still, I wondered what would happen if we compared his latest sample to mine. In this chart, positive numbers are those that more abundant in my latest sample; negatives are more abundant in him.
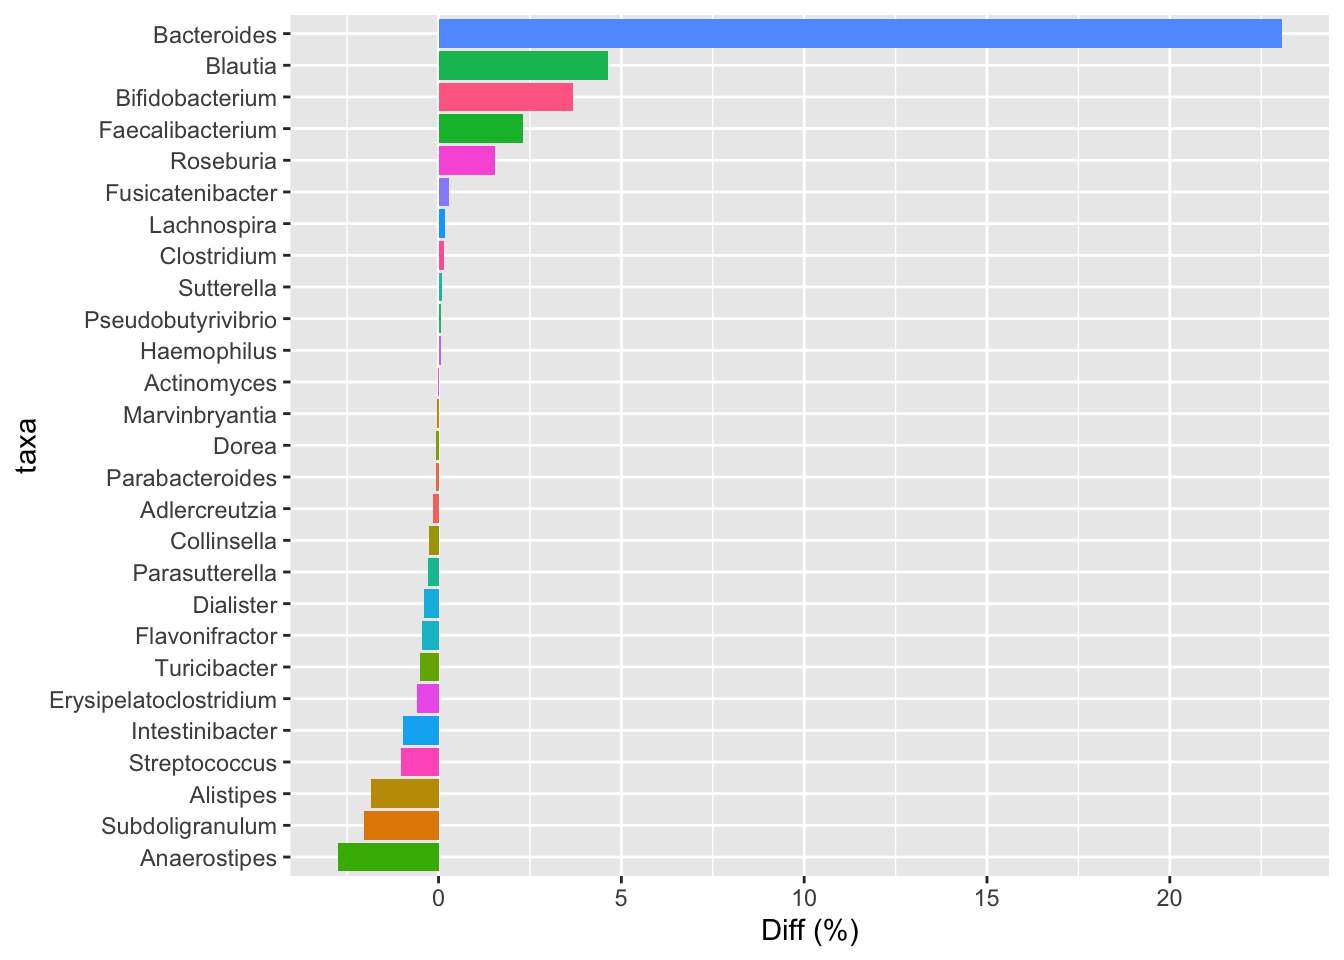
He has way more Bacteroides, Blautia, Bifido and many others, including the odd Megasphaera that he notes in his original post, whereas I have more Alistipes, Roseburia, and a number of others. I assume this is easily explained simply by our different diet types: I’m an omnivore, whereas Prashanth is mostly vegetarian, with some eggs and diary. Incidentally, in this comparison I applied a (controversial) statistical technique, called rarefaction, that tries to account for the fact that my my sample has nearly triple the number of reads as his. With or without the rarefaction correction, though, I didn’t notice a significant difference, probably because our samples are pretty different to begin with.
Finally, I tried to run some ordination plots across our samples, hoping to see if they would form “clusters” to highlight our differences. Sure enough, comparing the two reveals that his gut samples are significantly different from mine, except for two instances.
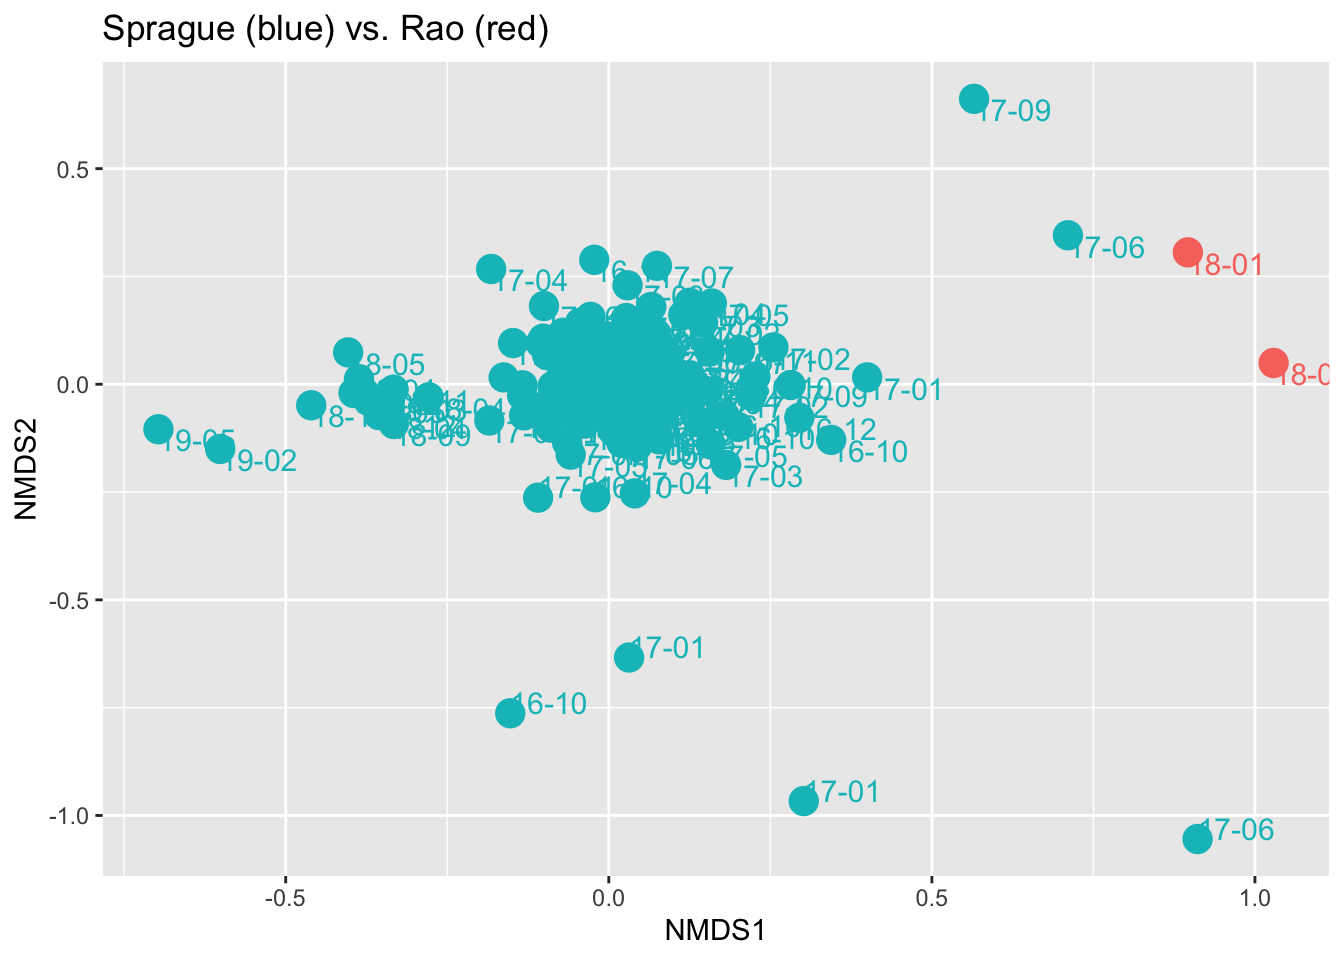
An ordination plot like this is a way to see in two dimensions a very complicated multi-dimensional space. Each dot represents a sample, and the distance between them is an indication of how different the samples are. In this case we see how the great majority of my samples are clustered together, mostly far from Prashanth’s. Still, I have a few samples (labeled ‘17-06’ and ‘17-09’) that seem much closer to his than to my “normal”. Interestingly, in both cases I had been on a heavier-than-normal lentil/bean kick at the time – edging a bit more closely to his diet type. Of course there could be many other explanations as well, all worthy of further study.
In conclusion, I want to express how awesome it is that Prashanth did this experiment. So much of what we read about the microbiome is based on hearsay and speculation rather than, as Prashanth did, real experimentation. The more people follow his example – applying personal science rather than simply reading about it – the better we will be able to understand the wonderful mysteries of the human microbiome.