How to think about microbiome diversity
Most microbiome discussions begin with the assumption that diversity is good. The intuition is easy to understand: if your body harbors a wide variety of microbes, you’ll have a deeper catalog of useful ones that can be applied to new situations. In a constantly changing environment, you never know what new threats or opportunities you may encounter. An abundant store of many different kinds of organisms make it more likely you’ll have something to meet unforeseen challenges.
In practice, diversity is difficult to pin down quantitatively. We know what we mean in principle: having a variety of different microbes seems good, but clearly there are limits. You wouldn’t want “variety” to include serious pathogens, for example. We know intuitively that a deciduous forest at sea level, with dozens of differerent tree species, is more diverse than one at a high altitude tree line. But is the one at low altitudes “better”? It depends on where you live!
A similar problem has long confronted ecologists, who have developed several diversity measures that have been adopted to the micro world:
-
Alpha diversity: the variance within a particular sample. Usually measured as a single number from 0 (no diversity) to infinity, or sometimes as a percentile, this is what most of us mean when we look at our microbiome results and ask about diversity.
-
Beta diversity: how samples vary against each other. Many scientific studies are interested in the differences between sites on the body, or microbiomes across geographic locations. Beta diversity is typically the thinking behind “clustering” algorithms that try to show differences or similarities among samples.
All diversity metrics take into account two aspects of a community: the number of different organisms in a sample, and the range of abundances for each one. To understand how this works, think of two forests, each with an equal number of trees. (Table 1)
Table: Table 1: Diversity example: two forests with an equal number of trees, and one with fewer trees.
| Forest | Number of Trees | Number of Species | Diversity |
|---|---|---|---|
| A | 1000 | 1 | Low |
| B | 1000 | 1000 | High |
| C | 10 | 10 | ? |
Clearly, Forest B with its abundance of species and trees is the most diverse. But what about Forest A compared to Forest C?
On the one hand, Forest C seems to have a greater variety of trees: 10 times more than Forest A. But it also has many fewer of them. In other words, there are two aspects of diversity that matter: the absolute number of organisms in an ecosystems, and the variety or richness of those that are there.
Whether A is “better” or “worse” than C depends on subjective, non-quantifiable factors that are not included in any diversity metric. A managed forest, such as one on a Christmas tree farm, might be perfectly healthy for one purpose (growing Christmas trees for sale), while an adjacent clear-cut forest with ten lonely and scraggly trees could be far less healthy, even if it has more of a variety of trees.
In this example, we use the distinction richess to refer to Forests B, or C, with their greater variety of species, and the overall term diversity tries to be a measure of both richness and abundance.
We can apply the same principle to our taxonomy tables: A microbiome sample with 100 unique taxa is more diverse than one with only 10 unique taxa. But if we just use raw, absolute numbers, it can be hard to compare across different microbiome tests. For example, what if I have two samples, each with 100 unique taxa, but in one sample there are tiny amounts of all but one of the taxa, while the other sample has equal amounts of everything? Which is more diverse?
One way to quantify this is with a metric borrowed from probability theory. What if, instead of looking at all the taxa and their respective amounts, we simply take at random any two taxa from the sample: what is the probability that the two will be the same?
If I have a sample with 100 unique taxa, each of identical abundance, then the odds are pretty low that I would select at random two of the same taxa; conversely, if a majority of the sample consists of the same taxa, with many other taxa of smaller abundance, then the odds are pretty good that the two I select would be the same.
In fact this is generally the case in healthy western guts, which are usually composed of only two large phyla: Firmicutes and Bacteroidetes. In my case, as you’ll see, these two phyla make up over 90% of everything I see in my samples; the third most abundant taxa rarely breaks 10%. The odds that you would randomly pick these two is pretty high. That’s the intuition behind the Simpson metric, developed in 1949 by the British scientist E.H. Simpson.
But note that with Simpson, high numbers mean low diversity; after all, in a homogeneous sample with no diversity, the odds that you’ll pick the same taxa will be 100%. To keep this consistent with the idea that higher numbers mean more diversity, most scientific studies of the microbiome use Inverse Simpson, which is simply 1 divided by the Simpson number. Note that for very low Simpson numbers, the Inverse Simpson value can be quite high, even approaching infinity when dealing with a microbiome with many unique and extremely low abundance taxa.
The taxonomy of microbes matters too. Each successively lower taxonomical rank always has at least as many taxa as the higher levels, so you can’t simply count the total number of taxa at a rank. A single genus like Bifidobacterium, for example, can have dozens of species associated with it. For this reason, microbiologists usually measure diversity at the Family level: it’s a good compromise between overall coverage and specificity of taxa.
In the real world, the type and variety of microbes in the body are constantly changing, so it’s important not to get too hung up on a single number for a single sample. You’ll see this in a later post when I show how my microbiome varies over time. The key is to take multiple samples and not rely on a single day’s measure. If you take many samples, you’ll find that the moving average is much more stable, and a better overall indicator of diversity.
There are other measures of diversity as well. The Shannon Index borrows from Information Theory to ask how much unique information is contained in a given sample. A radio signal that broadcasts random static, for example, would have a lower Shannon number than one for a music concert. Similarly, a microbiome a boring makeup – all the same species, for example – would have a lower Shannon number than one containing a rich abundance of many different types of microbes and abundances. In practice, Shannon and Inverse Simpson tend to track one another reasonably well, a clue that they are getting at a similar idea.
## `geom_smooth()` using formula 'y ~ x'
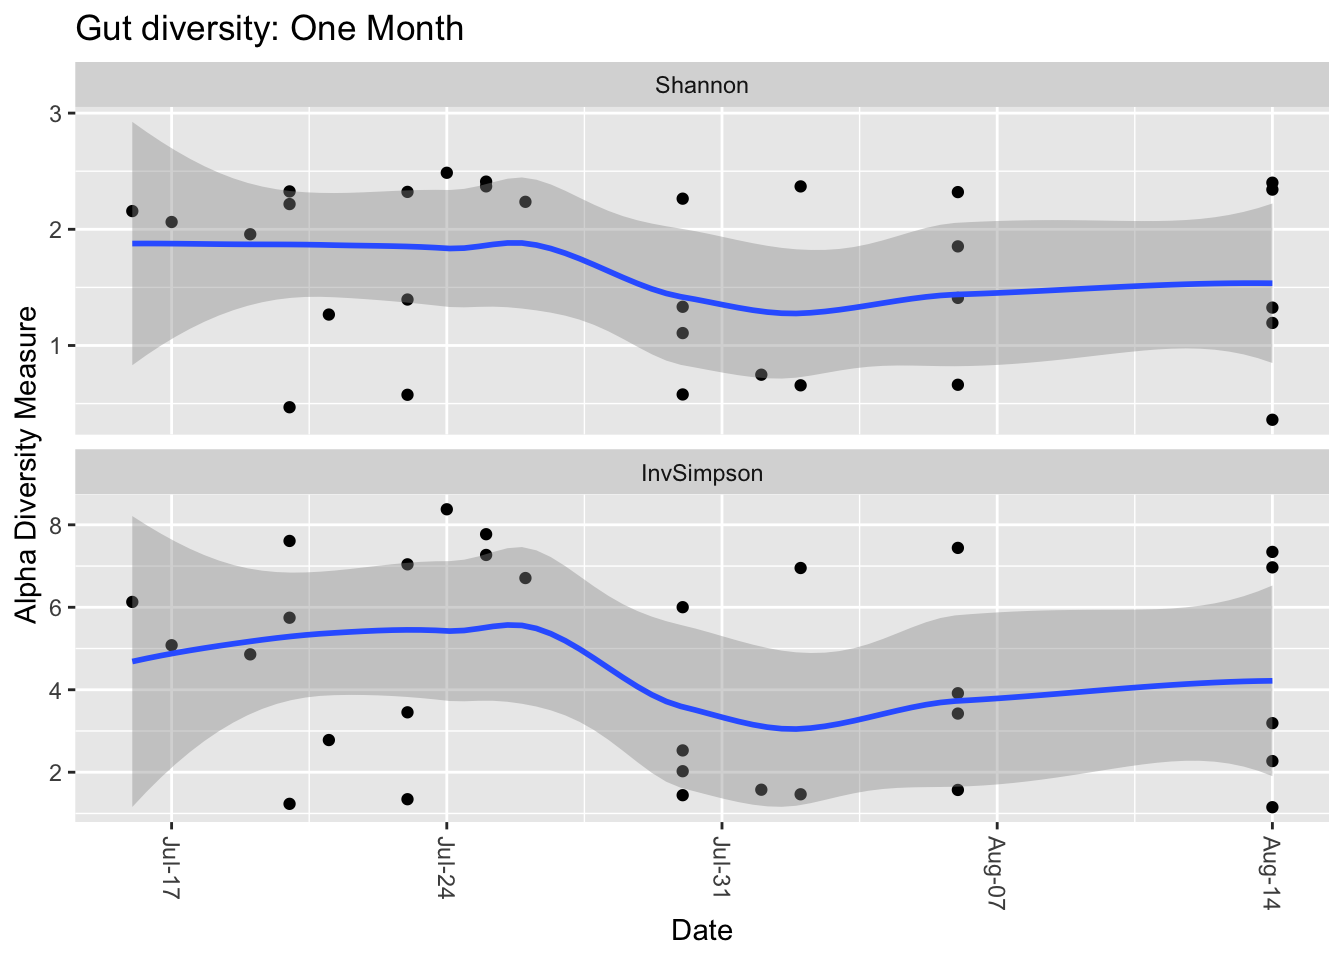
Figure 1: Comparing two types of diversity.
That said, Shannon tends to fall within a narrower, more predictable range, so I prefer it over Inverse Simpson when looking at my own samples. It often doesn’t matter which metric you use, though, as long as you’re consistent.
Nevertheless, I have learned to not place much stock in any diversity measure. After all, whether diversity is “good” or “bad” depends on what is in the sample. Is high diversity good even if it includes many known pathogens? Is “low” diversity good if it only includes one or two known commensal bacteria? As always in the microbiome world, it’s hard to tell.
For much more about the microbiome, check out my 300-page free ebook Personal Science Guide to the Microbiome.